How much GHG are actually released worldwide? And which are its main sources? Has humankind been successful at reducing the emissions of greenhouse gases? How much harmful is the meat industry and how much do our cars and plane journeys pollute? Are electric cars really a more eco-friendly option than fossil-fuel powered cars? Let’s find all this out.
A Changing Planet With Too Much Greenhouse Gases
The planet’s ecosystems have always produced greenhouses gases (GHG) as they’re needed to keep the Earth at a temperature of perfect balance, preventing it from getting too cold. The problem is that since the 1st industrial revolution, the amount of GHG released to the atmosphere has increased exponentially, causing too much of the planet’s heat to get trapped inside the ozone layer, provoking an increase in the average temperature of Earth. This global warming has negative consequences for life on the planet today – it melts down glaciers raising the sea surface level, accelerates the loss of biodiversity, causes phenomena like ocean acidification and in many other ways contributes to the overall phenomena of climate change.
While all these problematic issues started being discovered and scientifically backed up, national and international communities have been gathering with the goal of finding out how to turn things around. And as we have examined in the sustainable conferences worldwide article, there is today an overall consensus on the need to fight climate change and prevent the planet’s temperature from increasing more than 2ºC compared to pre-industrial levels by the end of the century – the Paris Agreement.
Although no mandatory commitments were made in the Paris Agreement neither in the Climate Conferences (COPs) that followed, different, independent, sustainable initiatives have been taking place in different sectors and industries, some with the goal of reducing the amount of GHG released. There are several types of GHG with different global warming potentials, and since we need one single unit to calculate GHG emissions, the global warming potential of each GHG is often converted into CO2eq. But how much CO2eq, commonly referred to only as CO2, has humankind been releasing?
- Related:
Greenhouse Gases Today – The Increase In CO2 Levels
Between 1750 and 2011, cumulative anthropogenic CO2 emissions were ~310 GtCO2, from which 40% has remained in the atmosphere, 30% was absorbed by the oceans and the rest stored in soils and plants. According to the IPCC, 50% of these emissions took place in the last 40 years, caused mostly by economic and population growth, people’s lifestyles, land use patterns, energy use, technology and (lack of) climate policy. In fact, until around 1950, land-use change and deforestation were the most significant source of annual CO2 emissions.
Although we’re aware of the need to gradually decarbonize the economy, things haven’t really improved. According to research the Global Carbon Project released in the COP24, estimates are that CO2 emissions in 2018 hit a historical maximum of 37.1bn tonnes. This means projected global emissions rose 2,7% in 2018, a significant growth compared of previous increases around +1%.
Who Are The Top Countries Emitting CO2?
The top four Co2 emitters are China (27% or 9.6GtCO2), the US (15%), EU28 (10%) and India (7%). As well, India and China’s GHG contributions have been the ones increasing the most, by 6% and 5% respectively, followed by the US with 2,5% growth. Europe, on the other hand, is expected to have decreased its GHG emissions by 0,7%.
Countries with the biggest share of emissions don’t necessarily have the people with the worst ecological-footprints Because even though China releases the most CO2 due to its large population of ~1.4billion people, the US is the country with the highest emission per capita – 16.2tonnes/person in 2017. In comparison, China and the EU28 both have emissions of 7tonnes/person in 2017.
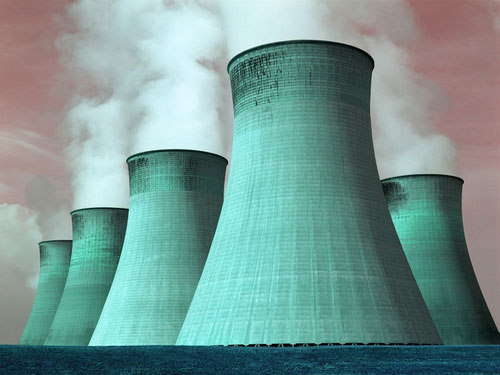
Interesting too is the fact that coal owns 40% of the share of global fossil CO2 emissions in 2017 – it’s the fossil fuel that most contributes to carbon emissions. Oil accounts for 35%, gas for 20%, cement for 4% and flaring for 1%. However, despite coal being ranked first use, global energy production is still mostly coming from oil, with an annual global consumption of ~56m Gw/h, followed by coal (-42m Gw/h), gas (~35m Gw/h), hydro, nuclear and other renewables.
Which Economic Sectors Are Using More Greenhouse Gases?
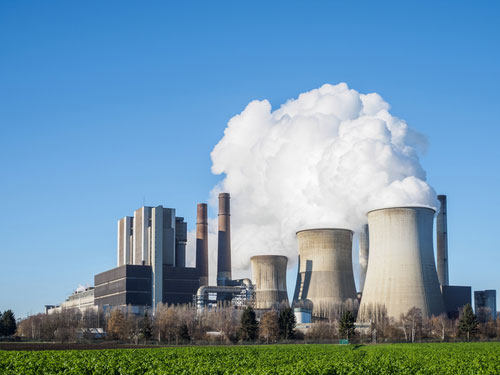
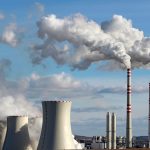
The main contributor (25%) of carbon emissions is the burning of coal, natural gas, and oil for electricity and heat. Afterward, 21% of emissions come from the industry, specifically from burning fossil fuels on facilities for energy. Agriculture, forestry and other land use own 24% of global emissions, mostly due to the cultivation of crops and livestock and deforestation.
A degree lower is transportation, which had 14% of the GHG emissions in 2010. Buildings had 6% of the total, coming from onsite energy generation and burning fossil fuels for heat in buildings, cooking or home (energy for electricity isn’t covered here as it is instead in the 25% slice). Other emissions from the energy sector that aren’t straightly related to electricity or heat production like fuel extraction, refining, processing, and transportation, represent the remain 10% of emissions.
If we dig deeper into the transportation sector, road transportation is accountable for 72,06% of GHG Emissions. It is followed by international and coastal shipping (9.26%), international aviation (6.52%) and domestic aviation (4.1%). Rail, indirect emissions, HFC, pipeline and domestic waterborne make up the remaining emissions. And although some attention has been drawn to avoiding using planes, IPCC’s graphics show there’s not much of a big difference between the pollution per km per passenger between cars and planes, especially between city drives and short flights. So perhaps people should worry more about not using their cars, as domestic road pollution also has a big share of the total road pollution, than not using planes (although trains are a far better idea).
Decarbonization And The Transition To Renewables
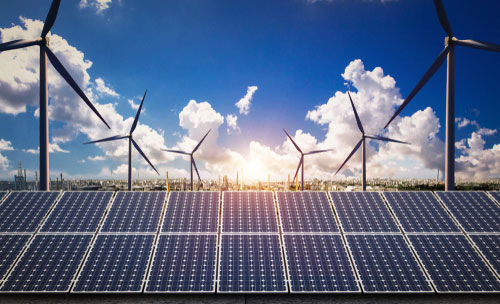
Even though renewable energies are growing exponentially as their costs become more competitive, they haven’t yet grown enough to offset the growth in fossil energy consumption. All sectors need to do more to help decarbonize the planet and get on track to prevent the 2ºC temperature increase. In 2018 Co2 emission grew, mostly due to the increase in coal burning in China and India as their economies grew. And although renewable energy grew rapidly, it wasn’t enough to offset the increased use of dirty energy sources.
China is still producing most of its energy from coal, however, they’ve been largely investing in renewable energies like wind and solar, which grew ~25% over the last years, and in nuclear energy, which grew ~20% as well. At the same time, in other regions like India, the US, and UE, the use of renewable energy from the sun and wind has also increased by +12,8%, 11,6% and 8,6%, respectively. This is the way to go – investing in a cleaner, green, decarbonized, grid.
We need to prevent the 2ºC increase. Doing so requires emitting less GHG. Between 2008 and 2017 there has been a carbon imbalance. Through fossil fuels burning (87%) and land use (13%) we’ve produced nearly 40GtCO2 carbon emissions a year. Of this, the atmosphere absorbed 44%, trees, plants and soils sank 29%, and the oceans 22%. This leaves a carbon debt of 5% or 1.9GtCo2/yr. We need to turn this around. Even if we do so, there will still be a lot of difficult challenges to overcome and there’s nothing we can do to change this. What we can and must do, is definitely to adapt to climate change and try to mitigate its effect. How? That’s a discussion for another article.
Image credits to solar on Shutterstock, power on Shutterstock, coal on Shutterstock and emission on Shutterstock